Greg Livingstone of Fluitec International and Jo Ameye of Fluitec International
Abstract
Lubricating oils are undergoing more changes today than they have at any time in recent memory. This has been driven by the switch to more advanced base stocks which require new additive chemistries, the increase in equipment performance duties and more extreme lubricant operating conditions. These are among the factors that have contributed to an emerging problem of lubricant ‘varnish’ deposits caused by oil degradation. Varnish is a sticky residue that can cause valves to stick, flow lines to block, filters to foul and bearing friction to increase, leading to reliability problems across several industries. This article highlights how varnish is formed, what problems it can cause and how to test the new generation oils for varnish deposit forming tendency. This paper will also discuss proactive methods and technologies available to solve varnish deposit problems.
New Technology Lubricants
Many types of lubricating oils and hydraulic fluids are being formulated differently today than they were a decade ago. Industry’s drive towards more globalization and efficiency improvements sets off a chain of events, impacting all aspects of an operation. Manufacturers are demanding faster, smaller, more efficient machines. The OEMs deliver, however the upgrade in machine technology typically means more stress on the lubricant. The OEMs have strengthened their specification, demanding that the lifeblood of their equipment has oxidatively stable oils that can be used longer, at higher temperatures in smaller spaces and with the ability to withstand a wide range of contaminants. These new demands cause the oil companies to change their formulation chemistries to meet more demanding specifications. The oil companies first meet these new demands by making a change to their lubricant’s base stock. Newer synthetic chemistries are increasing the energy efficiencies and solving problems that wouldn’t be feasible with mineral oil base stocks. However, the biggest change has been the global adoption of more advanced mineral oil base stocks. American Petroleum Institute classifies different base stocks into five different categories. An explanation of the various base stock classifications is below:
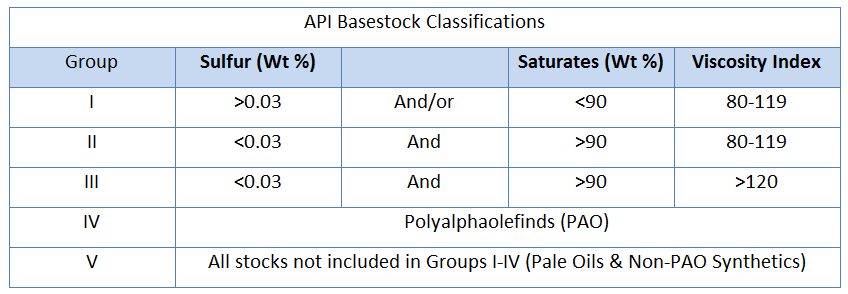
Group I base oils are manufactured by solvent extraction, solvent or catalytic dewaxing, and hydro-finishing processes. The oils are more polar in nature due to their remaining contaminants, however these polar species leads to a higher solvency than other paraffinic base stocks. They also have high natural oxidative stability compared to other base stocks.
Group II base oils are manufactured by hydrocracking and solvent or catalytic dewaxing processes. Fully formulated Group II lubricants have superior antioxidant properties since virtually all hydrocarbon molecules are saturated. It typically has a water-white color.
Group III base oils are manufactured by special processes such as isohydromerization or severe hydrocracking. These oils are extremely non-polar and often require the addition of an ester or aromatic compound to increase its solvency to a sufficient point to hold additives in solution. This fluid also has the lowest natural oxidative stability, however have the highest oxidative stability in fully formulated lubricants.
Informally, oil manufacturers have created two new categories to further distinguish mineral oils – Group I+ and Group II+.
The shift from Group I oils to Group II and III oils has also resulted in a significant change in formulation strategies. This new generation of oils degrades differently than traditional formulated lubricants. Although, this is technically more a function of additive chemistry rather than base oil, the base oil is a strong influence on the type of additive components that are used. Instead of degradation occurring in a linear and predictable fashion, many of these newer lubricants last longer, perform better but fail quickly. One of the failure modes is the creation of deposits, otherwise known as varnish.
The Causes of Oil Degradation and Varnish
The chemical composition of varnish can be extremely varied, hence it is defined by its appearance rather than its chemistry. Typically, sludge is considered to be wipeable, gooey, and contains moisture. Varnish has a more cured, shiny glean and not easy to wipe.
Varnish is primarily caused by the continual process of oxidation, resulting in the loss of an electron to one of the molecules in the lubricant. Virtually everything is susceptible to degradation from the presence of oxygen – lubricant’s are not excluded. Antioxidants are typically formulated into modern lubricants because they are more reactive species than the base oil. The oxygen more readily reacts with the antioxidants, who sacrifice themselves to protect the base oil and significantly extend the life of the oil.
There are other common types of lubricant degradation as well. Sometimes the oil will react with water in a process known as hydrolysis. Thermal degradation is also a significant form of fluid degradation in many applications, where rapid oil degradation occurs in the absence of oxygen. Incompatible contaminants, including different additive formulations or base oils can react to form precipitates, gels and deposits. For example, some ester based oils will react negatively with mineral oils producing significant deposits. Also, acidic rust inhibitors are incompatible with basic rust inhibitors, creating flocculants upon mixing.
Varnish deposits can cause a wide range of reliability concerns. Varnish impacts the precision of servo-valves, affecting several vertical markets, such as robotic manufacturing, plastic injection molding, controls on the majority of world’s largest power generation facilities and the steering of Navy fleets. It can also cause premature bearing and gear wear in compressors, turbines and paper machines. And finally, varnish can develop in inconvenient places, clogging up oil lines and reducing the heat transfer ability of heaters and coolers.
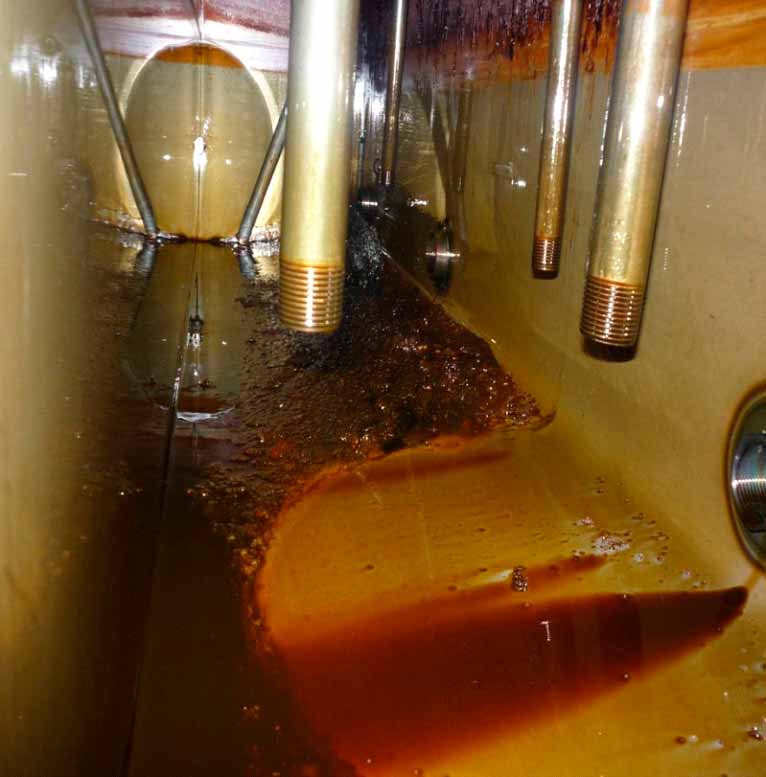
The image below shows sludge on the bottom of the reservoir. You can see where the return oil line is as it disperses the sludge. You can also see the formation of more tenacious deposits where the fluid level is. These deposits are typically referred to as bathtub rings and are more difficult to remove, even though the chemistry of the sludge is similar.
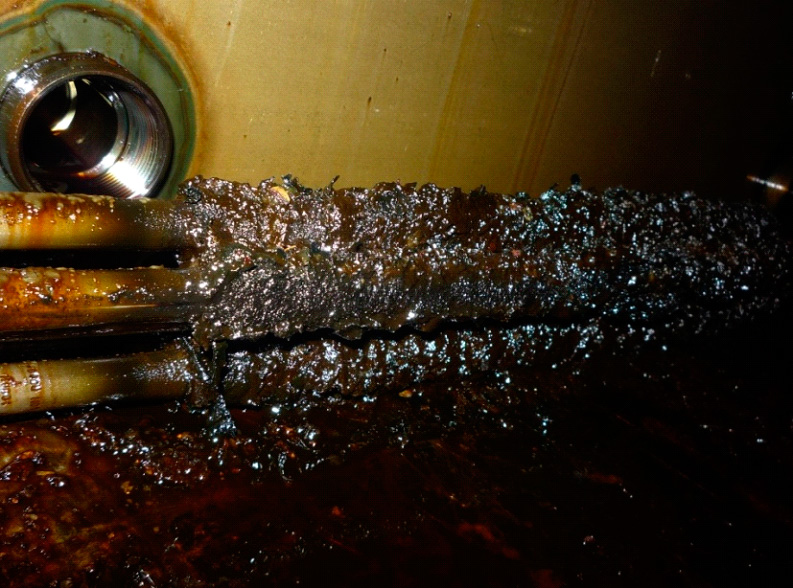
This image shows the formation of significant deposits on the heating elements inside the reservoir. This was a high wattage heater that contributed to rapid oil degradation and encouraged deposit formation.
The Formation of Varnish
Окисление – эOxidation is the initiating process of varnish formation. At this point, the soluble oxidation products will condense and polymerize together forming higher molecular weight objects referred to as oligomers. Depending upon their concentration, chemistry and temperature, these oligomers will eventually reach the saturation point of the fluid. After the solubility point has been reached, the contaminants will precipitate out of solution and form insoluble particles. These particles are also called soft contaminants and have a median size of approximately 0.08-microns in size. Soft contaminants are polar and attracted to each other in the non-polar environment of lubricating oils. Depending upon the flow conditions of the fluid, agglomerates of soft contaminants will form in the fluid and eventually find a place to settle out of the fluid creating a varnish deposit. This process is illustrated below.
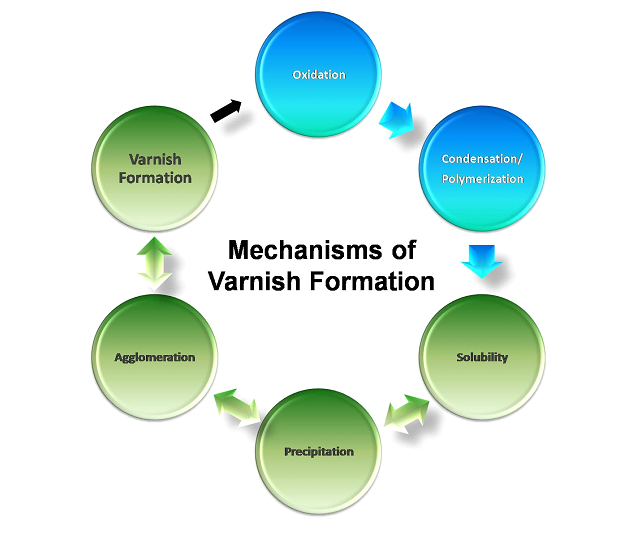
One interesting note about the varnish lifecycle diagram is that there is a double-arrow between the solubility-precipitation-agglomeration-varnish formation stages. This represents that in many cases, these reactions are reversible. In other words, it is possible for varnish that has already deposited in a system to be removed and re-absorbed back into the oil and then for these particles to become dissolved again back into the fluid. This is true with organic degradation products. Inorganic degradation products such as depleted zinc dialkyl dithiophosphate (ZnDDP), a common anti-wear that also functions as a secondary antioxidant, are not able to go back into solution and immediately form deposits upon their creation. In the case of ZnDDP, these deposits are inorganic sulphates and phosphates and can readily come out of solution upon depletion. The small black arrow pointing from the varnish stage to the oxidation stage represents that varnish can be a catalyst to promote further oxidation.
Rethinking Oil Analysis
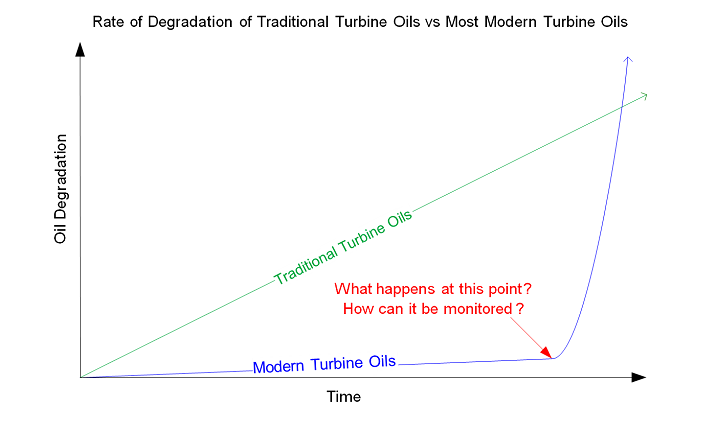
Oil analysis has been the primary tool to detect incipient lubricant failure for the last half century. There has been a rising challenge however in using traditional testing methodologies in predicting the point of lubricant failure and subsequent formation of deposits. Many research papers have highlighted that tests such as viscosity, acid number and ISO particle count are not able to predict early lubricant degradation and the formation of deposits. This is for a couple of reasons. First, the polar products formed from lubricant degradation are less than a micron in size – undetectable with routine analysis. Second, many of today’s new lubricant formulations no longer degrade in a linear fashion making it more challenging to predict when the lubricant will begin to rapidly develop deposits. The non-linear degradation of modern lubricants is related to the antioxidant selection as well as the oxidative stability of Group II and III base oils. Once the antioxidants have been depleted, Group II and III oils have less natural oxidative stability than Group I oils and degrade extremely quickly. As a result, the majority of standard oil analysis tests provide no warning as to when the lubricant will start to degrade and generate deposits. An illustration of how traditional lubricants degrade compared to most modern lubricant formulations today is presented below.
It is well understood that as a lubricant is exposed to thermal and mechanical stresses, its antioxidant package deplete. There are two ways to monitor the depletion of these important additives. Firstly, antioxidants can be indirectly monitored using oxidative stress tests such as Rotating Pressure Vessel Oxidation Test (RPVOT; ASTM D-2272) or High Pressure Differential Scanning Calorimetry (ASTM D6186). Secondly, antioxidants can be measured directly using Fourier Transform Infrared or Linear Sweep Voltammetry (ASTM D-6971), otherwise known as the RULER test.
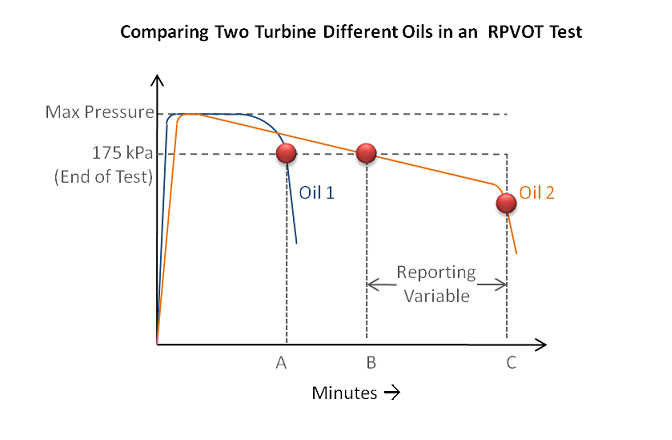
There has been a rising concern with oil analysts in using oxidative stress tests like RPVOT on modern lubricant formulations utilizing complex antioxidant systems. The precision of the test has dropped considerably compared to the precision statement in the ASTM standard. (ASTM D2272 states in the precision statement a repeatability of 12% and a reproducibility of 22% for oils with values less than 1,000 minutes. Many new lubricants have test values higher than 1,000 minutes.) The repeatability and reproducibility of the test, is generally accepted to be between 30-50%. A recent mini-robin at an international standards institute reported a 39% reproducibility result. Poor repeatability and reproducibility of the RPVOT test has made it much more challenging for data analysts to interpret the results. The image below illustrates some of the challenges in determining an end-point to the RPVOT test with modern lubricants. This illustration shows the difference between the RPVOT results in a traditionally formulated lubricant versus many modern formulations. Oil B represents the RPVOT results of many modern turbine oils. There is not a universal understanding of the end-point of the test, even though ASTM determines the end-point to be at 175kPa. This is one of the contributing factors to decreasing precision standards for RPVOT.
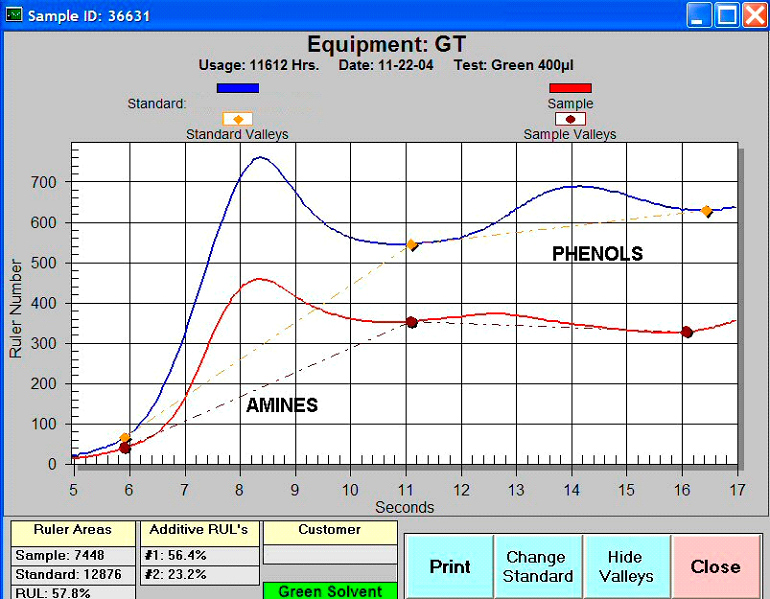
Directly monitoring individual antioxidants has been demonstrated to be a very good predictive method to monitor antioxidant depletion and provides a more thorough understanding of how fluids degrade. FTIR analysis is a powerful tool to identify molecular changes in lubricants as they degrade, including some antioxidants. The RULER is specifically engineered to track individual antioxidants and, unlike FTIR, the test is not influenced by other additive components. The RULER test identifies the type of antioxidants in the oil and by comparing the results to the new oil, allows you to determine how much of the antioxidants have depleted. An example of RULER results can be seen below.
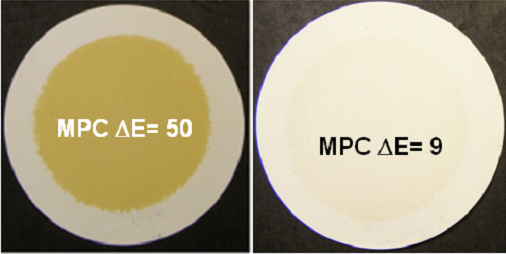
Once the antioxidants in a lubricant start to degrade, the first physical impact to the lubricant is the generation of extremely small, sub-micron contaminants. These contaminants may consist of degraded base oils, but at the early stages of development, often consist of the degraded antioxidants. Clearly tests such as ISO particle count, which measures particles greater than 4-microns and above, are not able to detect these particles. Other tests such as measuring the gravimetric weight of the insolubles or ultracentrifuges have shown promise, but are also influenced by larger contaminants. The test that has shown the most promise in identifying degradation by-products is referred to as Membrane Patch Colorimetry (MPC). This is a relatively straight forward test. Fifty milliliters of sample are mixed with an equal amount of solvent (usually petroleum ether) and filtered through a 0.45-micron patch. The color of the patch is then analyzed with a spectrophotometer and the total amount of color is reported. Most laboratories report the result as CIE LAB DE, the same scale that is currently used in the draft standard being developed by ASTM.
Below are a couple of examples of patches and their corresponding MPC value.
Тесты RULERThe RULER and MPC tests are complimentary. RULER identifies the depletion of the antioxidants and provides critical insight to when a fluid will start to exponentially degrade. MPC measures the formation of these degradation products, allowing users to predict when deposits will start to settle out in their lubricating system. These two tests are appropriate tools to use for predicting the creation of deposits in modern lubricant formulations.
УдалениRemoving the Contaminants that Cause Lubricant Varnish
A decade ago, there wasn’t a vendor in the industry that claimed to have a “varnish solution”. As varnish became recognized as a key factor in impacting reliability in manufacturing and power plants, some existing technologies refocused their product specification sheets to say “varnish removal systems” instead of sub-micron particulate removal. This led to the introduction of over a dozen new technologies that have been commercialized over the last few years that claim to “solve” varnish. Most of these technologies perform well however there is not one technology that is able to provide the solution to all problems.
The success of a varnish mitigation system to adequately remove sub-micron contaminants and free a system of varnish concerns is determined by the:
- Chemistry of the contaminant
- Temperature of the fluid that is to be treated
- Sizing of the varnish mitigation system
Oil degradation products are either organic and soluble, or inorganic and insoluble in nature. When the degradation products consist of depleted metallic-based additives, such as ZnDDP, the deposits consist are inorganic and have difficulty remaining in solution. These contaminates require a technology that can efficiently remove sub-micron contaminants.
If the oil degradation products are organic in nature, they typically consist of degraded antioxidants such as phenols and amines, and often oxidized base oil. These degradation products are soluble – meaning that they will transition in and out of solution if the physical characteristics are correct. Typically, these type of contaminants have a “melting” point between 40oC and 50oC. When the oil is at 50oC, most of these organic soft contaminants are in solution. Clearly, the filtration technology required for these types of contaminants depends upon the temperature of the fluid that is being treated.
The varnish mitigation system also needs to be sized appropriately. Varnish mitigation systems are kidney-loop filtration systems, usually consisting of very low flow rates compared to the system’s flow rates. Similar to sizing other contamination control technologies, varnish mitigation systems must be able to remove soft contaminants at a rate that is quicker than their rate of production.
Types of Varnish Mitigation Systems
Following is an overview of the various types of varnish mitigation systems available in the market today:
- Electrostatic Oil Cleaners (EOC)
Utilize electrostatic forces to charge contaminants. These devices work by attracting negatively charged particles to a positive collection zone and positively charged particles to a negatively charged zone through a phenomenon known as electrophoresis. Some particles are neutrally charged, but can also be removed through a process called dielectrophoresis. Electrostatic oil cleaners require a non-conductive environment to function and are sensitive to small amounts of water contamination. They are effective devices are removing sub-micron contaminants that are in suspension.
- Charge Agglomeration (CA)
A process very similar to electrostatic oil cleaners where particles are charged with electrostatic forces and then allowed to agglomerate in size. The charge on the particles does not relax within the confines of the filtration equipment, meaning that agglomeration occurs when the oil returns to the lubrication system. When the sub-micron particles agglomerate to multi-micron sized particles, they are removed through conventional mechanical filtration. Agglomeration units have the same sensitivity to water as electrostatic oil cleaners.
- Depth Media Filters (DM)
Depth media filters can filter particles down to approximately 3-microns in size. However, many of these filters are also constructed with a polar, cellulose media. In these cases, the polar oil degradation products are attracted to the polar nature of the media and adsorb onto the fibers. These units are effective at removing polar sub-micron contaminants that are in suspension, however if the oil is heated to above the melting point of the contaminants, all of the filtered oil degradation products will melt back into solution, re-contaminating the fluid.
- Electrophysical Separation Process (ESP)
This patent-pending technology was designed to remove organic soft contaminants from the lubricants. Utilizing a selective absorptive filtration media, the unique attribute of this technology is its ability to remove oil degradation products that are both in suspension and in solution. It does not impact other additive components in the formulation, nor is the filter media affected by water or other contaminants.
Most of these technologies work very well, however their limitations are in their application. The key is to understand what technology is best for what application. Below is a list of some variables to consider when selecting an appropriate varnish mitigation technology and recommended technologies based on application.
Table 1: Recommended Varnish Mitigation Systems based on the Chemistry of the Contaminants and Temperature of the Fluid
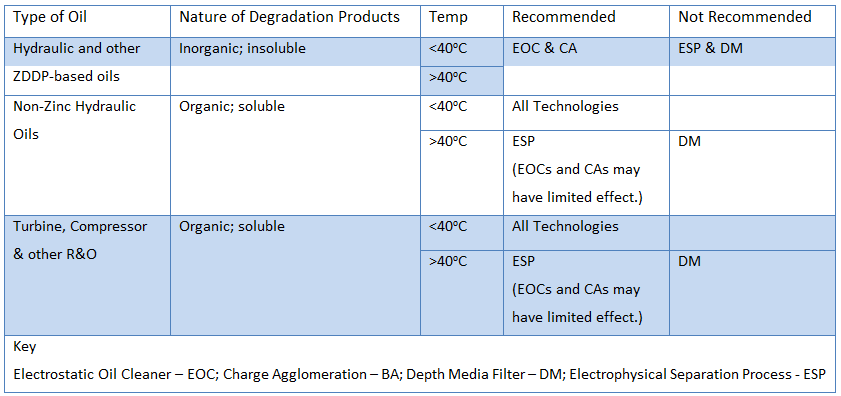
Electrostatic-based technologies are clearly superior when attempting to remove inorganic degradation products from the fluid, regardless of temperature. When dealing with R&O oils which produce organic degradation products, temperature becomes a large consideration. This is illustrated in the image below.
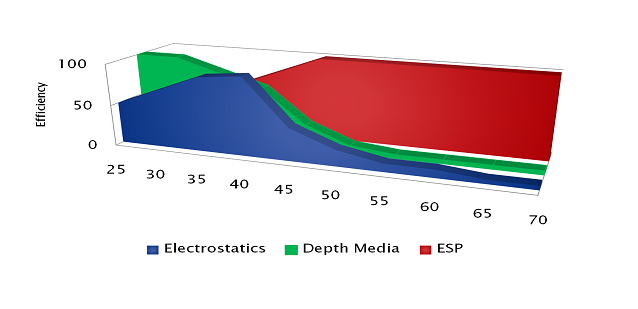
If a plant wants to remove oil degradation products from in-service lubricants during an outage and can have the oil cool for many days, all of the technologies will work to varying degrees of success. However, if the plant desires to permanently connect a kidney-loop varnish mitigation system to their reservoir, Electrophysical Separation Process is a preferred technology, which typically returns a contaminated lubricant to normal operating conditions within a week.
Summary
Lubricant varnish is an emerging problem for modern hydraulic and lubricant formulations, increasing maintenance, production and energy costs while decreasing plant reliability. This problem has coincided with a dramatic change in oil formulations, focusing on Group II and III base oils. Varnish is caused by fluid degradation; the leading contributor being oxidation.
A contributing factor to these new deposit problems is the fact that traditional oil analysis tests have not provided appropriate warning signs for incipient lubricant degradation and the creation of degradation products, which cause varnish. Incorporating oil analysis tests such as the RULER, which monitors the depletion of antioxidants, and MPC, which measures the creation of oil degradation products, has been shown to forecast varnish problems earlier than other oil analysis tests. Upgrading your routine oil analysis test slate with these technologies allow a manufacturing plant to go a long ways towards helping plants optimize the life of their lubricants.
When the varnish potential of a hydraulic oil or lubricant increases beyond normal values, a new generation of contamination control technologies is required to remove these sub-micron contaminants. Electrophysical Separation Process is an appropriate technology to consider when filtering R&O oils such as turbine and compressor oils.
In closing, we would like you to keep in mind that there are a lot of new sales pitches in the market about varnish. Everything from what type of oils to purchase, to appropriate condition monitoring tests and what filters will eradicate the problem. The sales pitches in many cases precede appropriate long-term research. When attempting to address a varnish problem, it is valuable to understand the root cause of the fluid’s degradation regime and to keep in mind all of the variables involved in applying an appropriate remedial technology. Finally, we suggest that you ask your vendors to back up their sales claims with performance guarantees to ensure that your plant is not victim to an under-researched sales pitch.